DANASTRA USE CASES


")


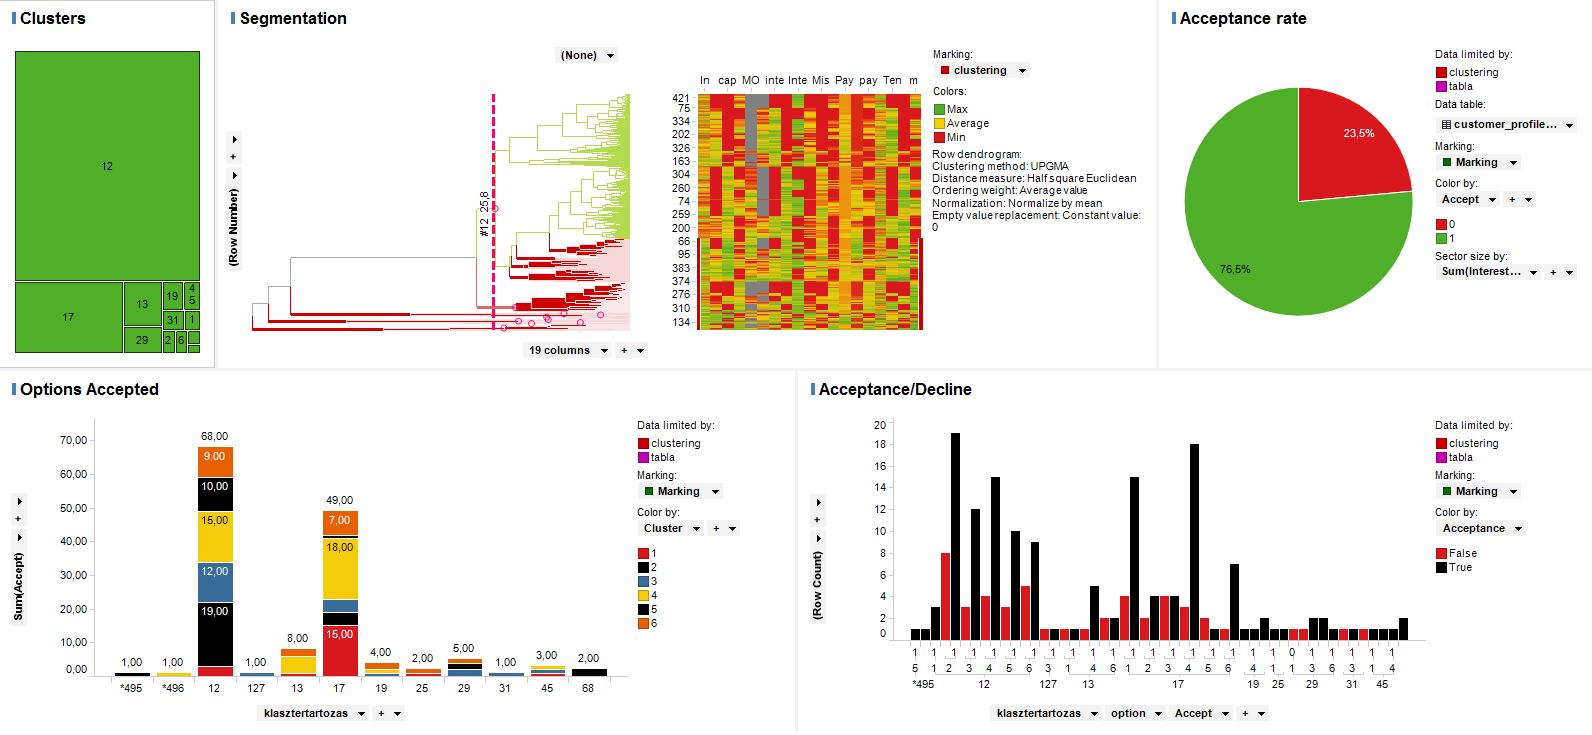
Shopping Mall Visitor Model
Challenge — How the Management Optimise the Marketing Spendings of a Shopping Mall to maximise Traffic and spending per Visit? How to Segment my Customers for better target Promotions & Campaigns? What are the internal and external Factors that drive Traffic?


Solution:
- Visitor Data is collected through Video Camera System, Beacons, Wi-Fi & Bluetooth Devices, Mobile Cellular Data & Point of Sale Systems. We blend it with Weather information, Promotional Calendars and Industry best practices to increase traffic, conversion and customer spending per visit.
- We built an econometric model to explore hidden drivers of Shopping Mall and Parking Lot Traffic to measure and forecast future Shopper activities.
- Based on captured Shopper behaviour we created a comprehensive customer segmentation to better target future Promotions.
KPI’s
- Traffic – The bedrock of reliable consumer insights starts with understanding who comes into your stores and when.
- Power hours – Determine your peak traffic times that generate the highest sales opportunities.
- Draw rate – Understand if your Marketing Campaigns & Promotions and window displays are drawing your fare share of Shoppers.
- Marketing effectiveness – Determine the cost per incremental Shopper and the return on Marketing investment.
- Real-Time Traffic – Make on-the-fly adjustments with real-time traffic Analytics both at Store and Shopping Mall level.
RESULTS

-
Real-Time access to visitor reports with built in Alerts enables Management to obtain insights on daily, weekly & monthly trends, seasonalities and enables prompt Reactions.
-
Parking report supports load balancing of free spaces in the parking lot to optimise gate traffic.
-
By spotting internal and external Factors that drive Traffic Visitor Model provides forecast and define baseline traffic to measure Promotion & Campaign effectiveness.
-
Customer segmentation ensures targeted and effective Marketing & Loyalty initiatives results in more often return of Visitors and higher spending per visit. We measure the prompt effects and lifetime value of Campaigns.
-
Measure Store performance and understand how Customers move through the Stores and obtain insights on their behaviour and drivers to turn Shoppers into Buyers.
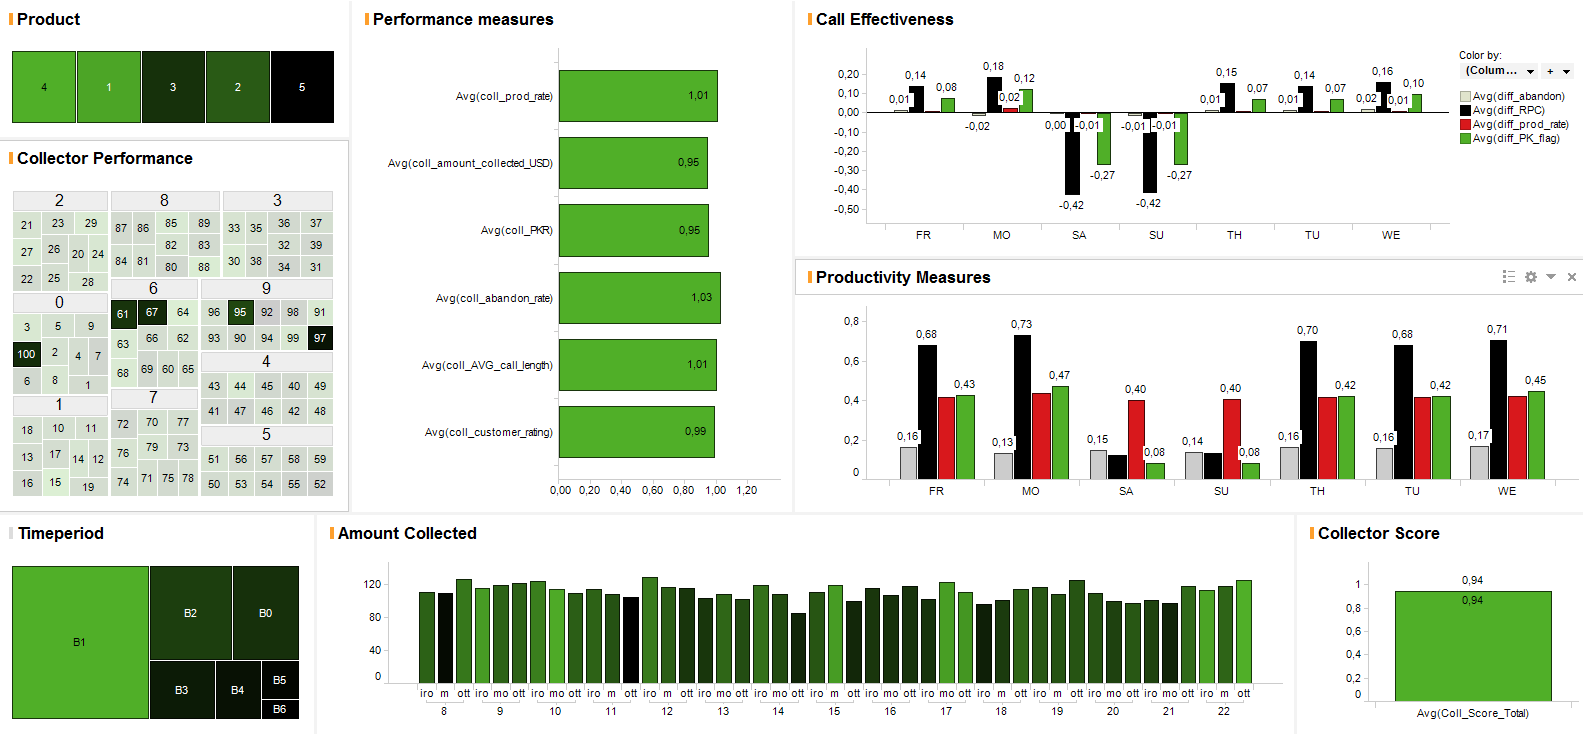
Collections Strategy & Optimal Staffing

Collection Strategy Framework effectively serves Risk Managers who strive to build up top notch Collection shop by using the power of advanced analytics and visualisation.
ANALYTICS
- Our solution enables users to analyse debtor behaviour by segments and to design effective collections strategy based on historical experiences and adjust it dynamically.
- Champion-Challenger testing objectively measures the success of new collections strategies comparing to previous treatments.
- Optimal Staffing Model advises optimal Collector allocation to treat every segment adequately and alerts if hiring or dehiring is required. The model will enable you to
- assess return on investment of planned staffing decisions
- better understand how collectors affect portfolio performance
- find financial opportunities for staff increase/decrease
MIS
Insightful visualisations and automated reporting system empowers Managers to hit the moving NCL target with high accuracy.
Standardised Collections KPIs, such as LLR, ENR, NCL, revenue and new booking volume trends provide a comprehensive overview of the Portfolio performance
Challenge – What is our optimal Collection Strategy? Which Collector should be assigned to a specific delinquency segment to improve efficiency? How many collectors do we need to run the shop? Which Collectors are performing well comparing to the others?
Solution — Our solution enables user to analyse debtor behaviour by segments and to design effective collections strategy based on historical experiences and adjust it dynamically. The model also advises optimal Collector allocation to treat every segment adequately and alerts if hiring or dehiring is required.
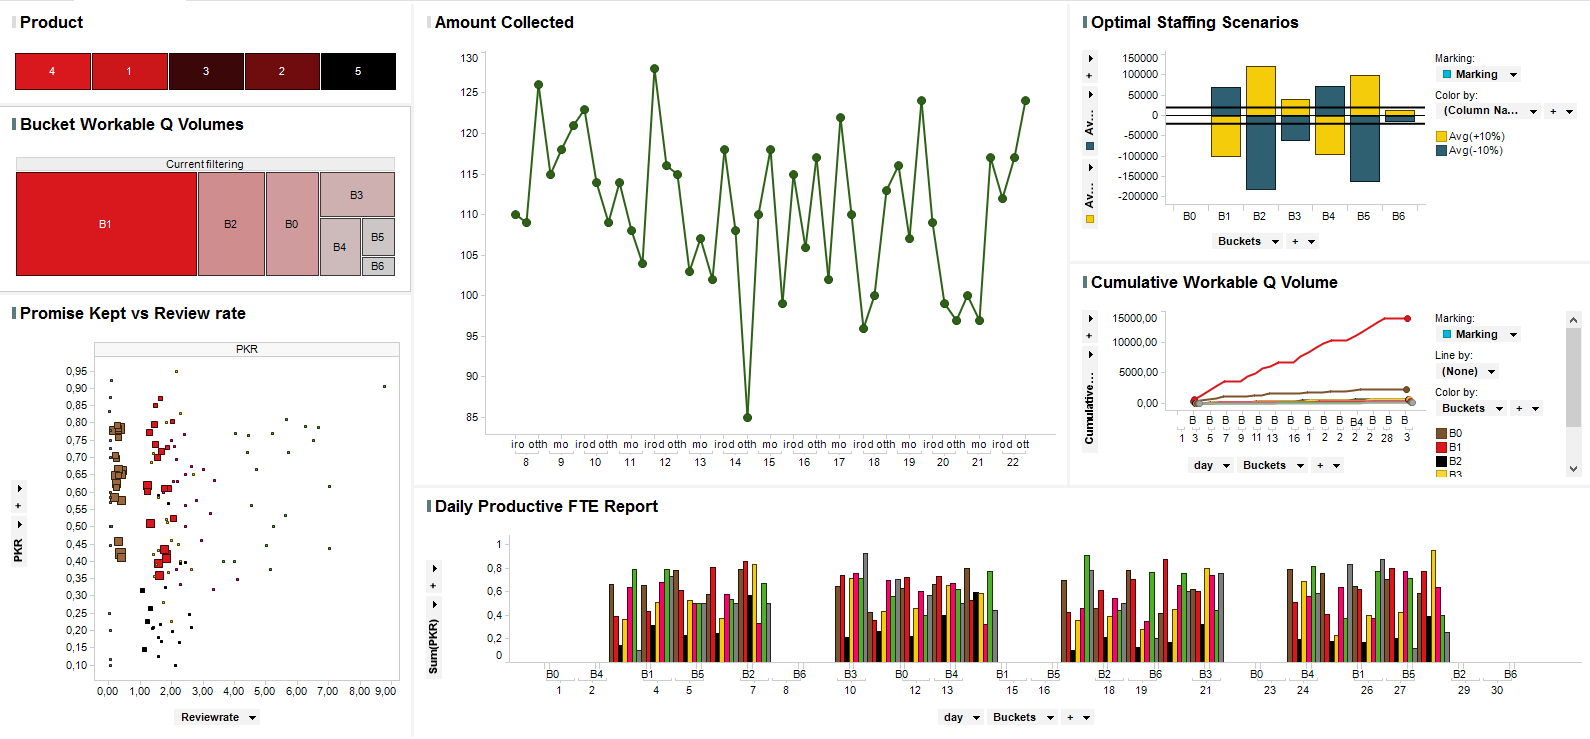
-
Enables Collection Strategy Managers to have a sound understanding on the behaviour of each delinquency segment that results in an effective strategy adjustment and Net Credit Loss save.
-
Predictive techniques provide early warnings by using pattern analysis on historical delinquency data.
-
Defining optimal staff level yields to collections operations cost saving.
-
Have a detailed and up-to-date picture on each staff member’s performance to design proper incentive system.
-
The impact of applied Risk Mitigation Tools are continuously tested and treatments are adjusted.
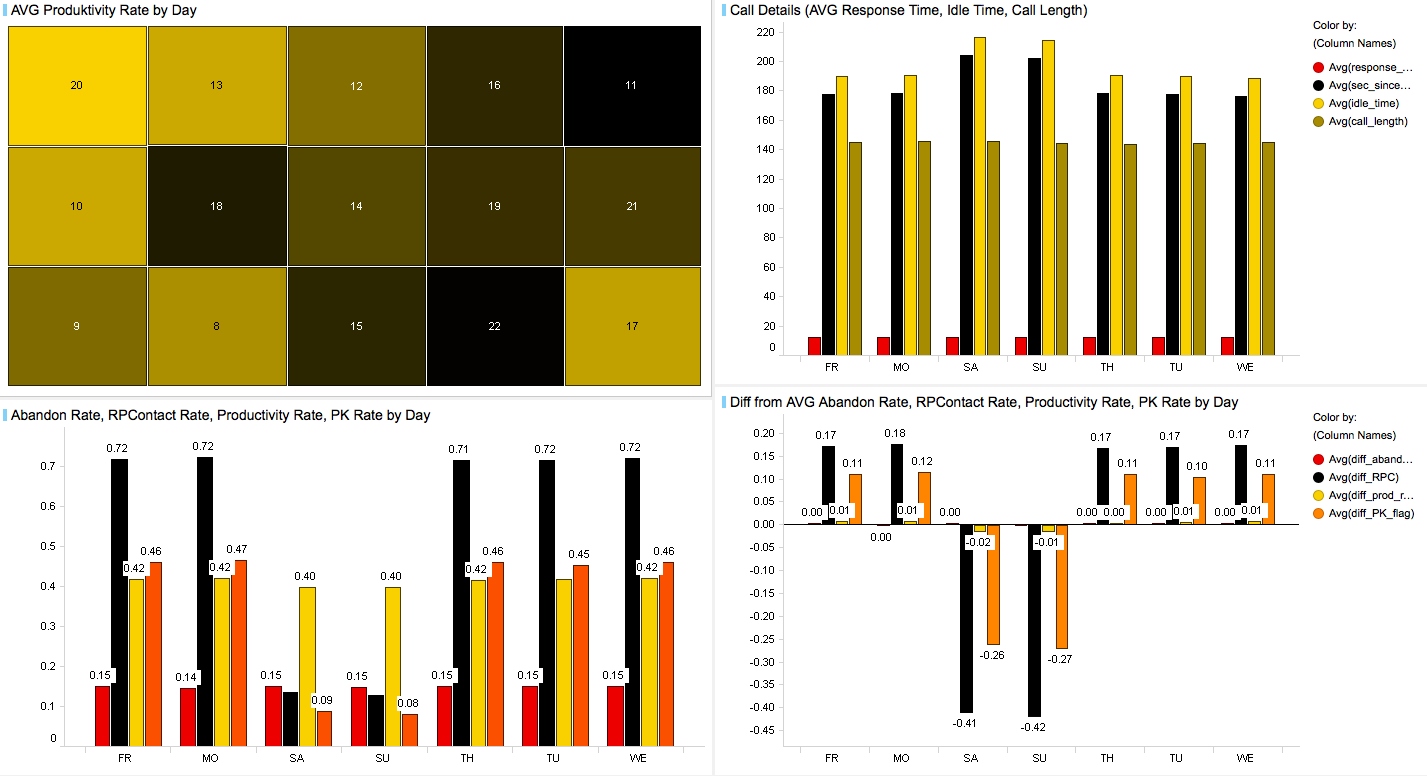
Call Centre Report
Challenge – When and in which channel should we call our customers? Which staff member should be assigned to a specific customer group to improve efficiency? How many collectors or sales representatives do we need to run the call centre? Which staff members are performing well comparing to the others?
Solution:
- Our solution enables you to analyse customer behaviour by segments and to design effective call strategy based on historical experiences and adjust it promptly.
- Starting from a high-level point of view, you are able to drill-down through each of your staff members’ performance or geographic hierarchy and spot those elements that can leverage efficiency. While doing so you can further limit the scope of analysis by focusing on product or customer groups to identify opportunities to improve.
- By digging down to the deepest level, our template will provide you with a full insight when and how a selected group of customers should be targeted to fulfil expected results.
RESULTS
-
Enables Call strategy manager to have a good understanding on the behaviour of each customer segment resulting in an effective call strategy.
-
Spot opportunities on the top level and follow them to the most elementary details.
-
Have a detailed and up to date picture on each staff member’s performance to design proper incentive system.
Fraud Strategy
Multiple Layers of Defence concept enables Fraud shops to
- See each Fraud Management component as a separate yet coherent layer of Security
- Define standardised, objective performance measure and develop automated MIS
- Assess the performance of each layer separately to identify hotspots
- Have a comprehensive view on the readiness of each defence line
The aim of this view is to
- Define the most important layers
- Associate a KPI set to measure the effectiveness of each layer
- Assess Fraud strategy components, fraud departments and individuals in this framework.

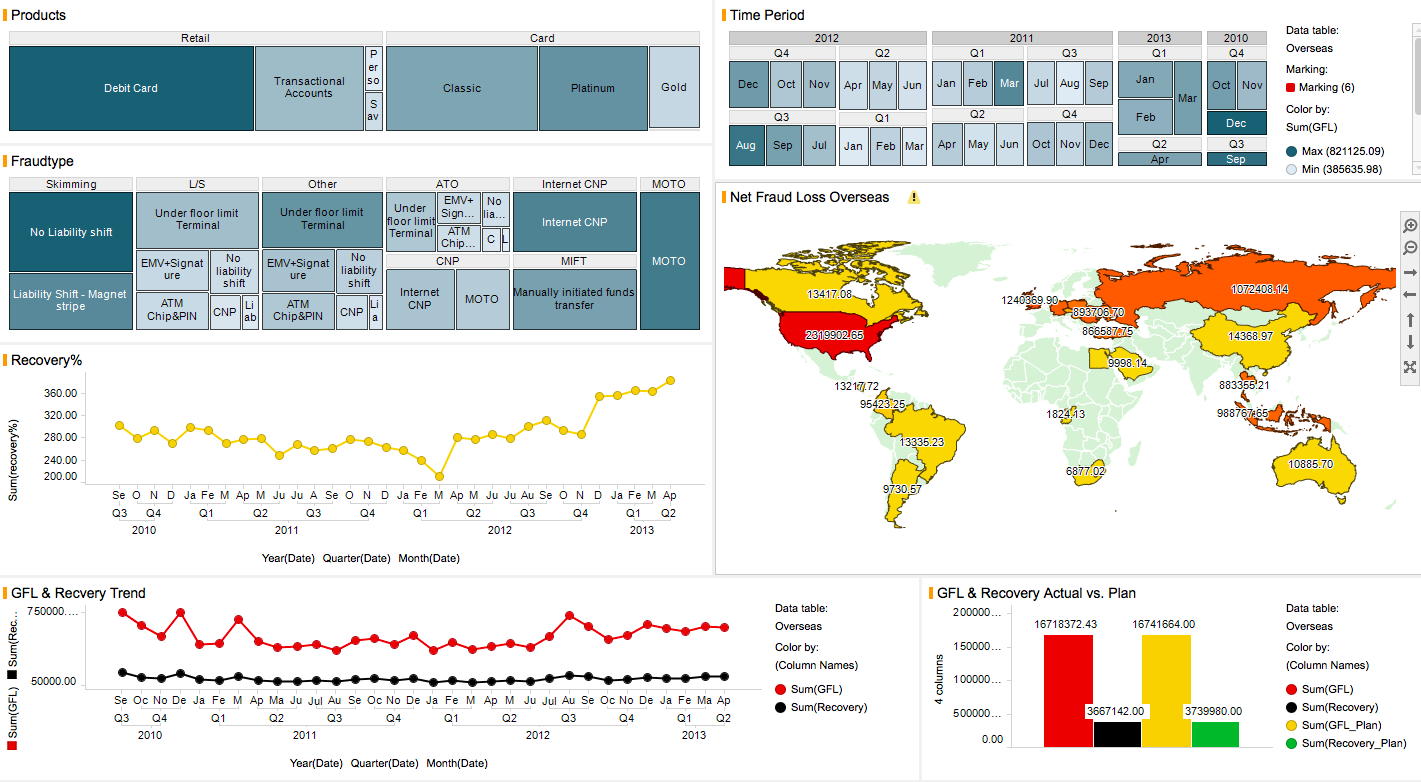
ANALYTICS
- CPP analysis – automated report which identifies collusive merchants or hacked ATMs by searching for common POIs in the transaction history of skimmed cards.
- Prevention – Detection of rapid cross-boarder transactions
- Customer profiling – segmentation of clients based on customer behaviour (card usage).
- Detection rule housekeeping – Rule performance pre-testing and fine-tuning
- Fraud pattern Analysis
RESULTS
-
Better detection performance (increasing detection rate)
-
Possible operations save (less false alerts by decreasing false positive rate)
-
Increasing customer satisfaction (less false alerts, better online authentication performance)
-
Decreased reaction time by automated MIS and Analytics Reports
-
Comprehensive understanding of country/business specific fraud behaviour and key drivers of Net Fraud Loss
Fraud Management Dashboard
Challenge – How to visualise Fraud performance quality reporting at a glance? What are the KRIs that are adequately indicating emerging risks, fraud trends and patterns? How to handle fraud management on a financial basis?
Solution – This report provides clear and comprehensive oversight for Senior Managers and Fraud Risk and Operations Managers. By applying transaction level data, we can ensure standardised and transparent KPI and KRI calculation and grant automated, up to date Fraud performance quality reporting.
Key Measures:
- Gross Fraud Loss – All types of losses that occurred during a certain timeframe due to fraud activity
- Recovery – Total amount of previously booked fraud loss recovered within a certain timeframe
- Detection rate – Percentage of detected fraud cases (excluding referrals) to all fraud cases within a certain timeframe
RESULTS
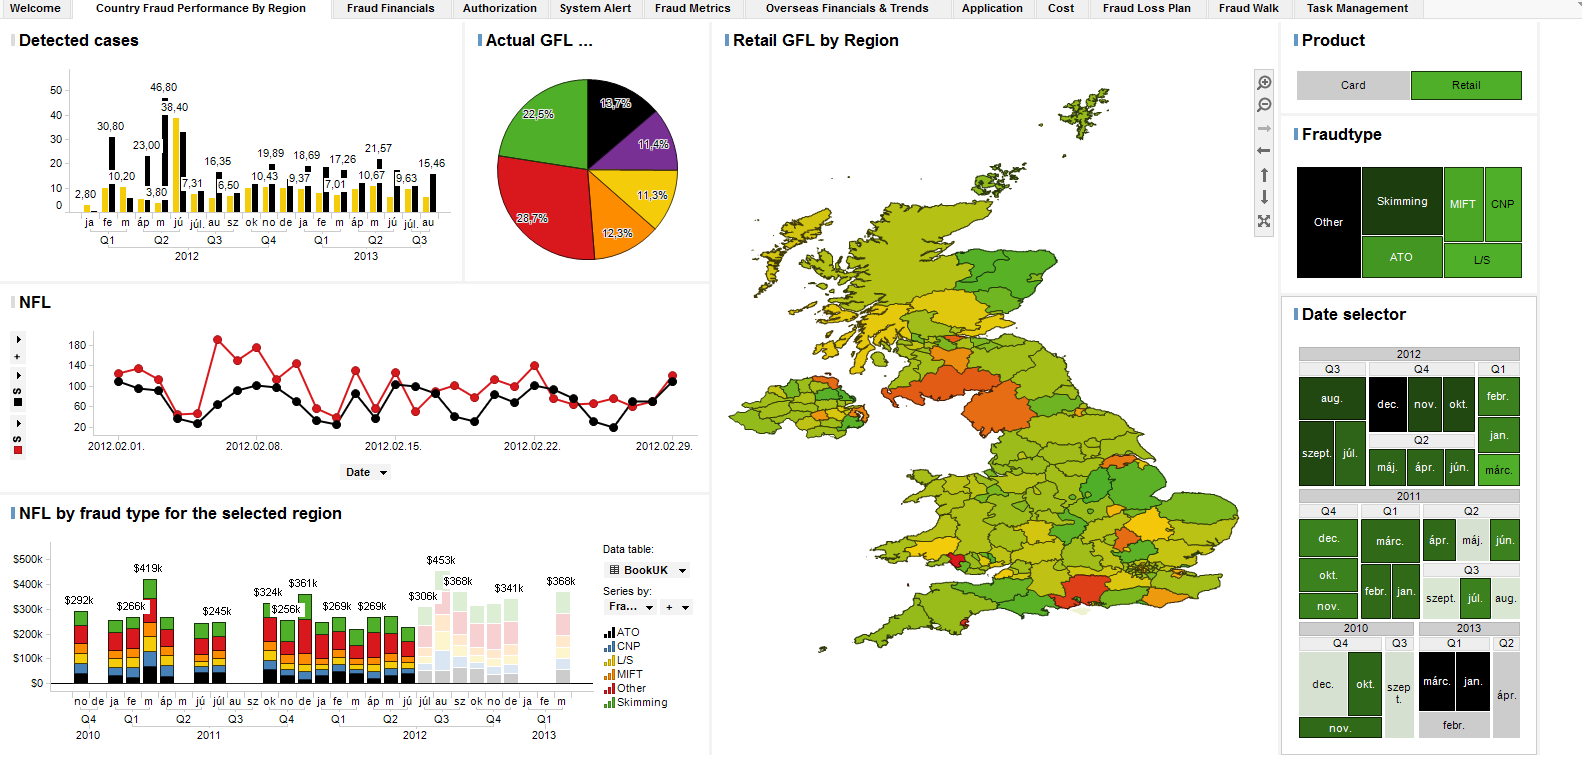
-
Up to date and comprehensive picture enables managers to adjust Fraud strategy swiftly according to emerging pattens results in significant Fraud Loss save
-
Details on demand
-
Automated report results in FTE and cost save
Compromised Purchase Point Analysis
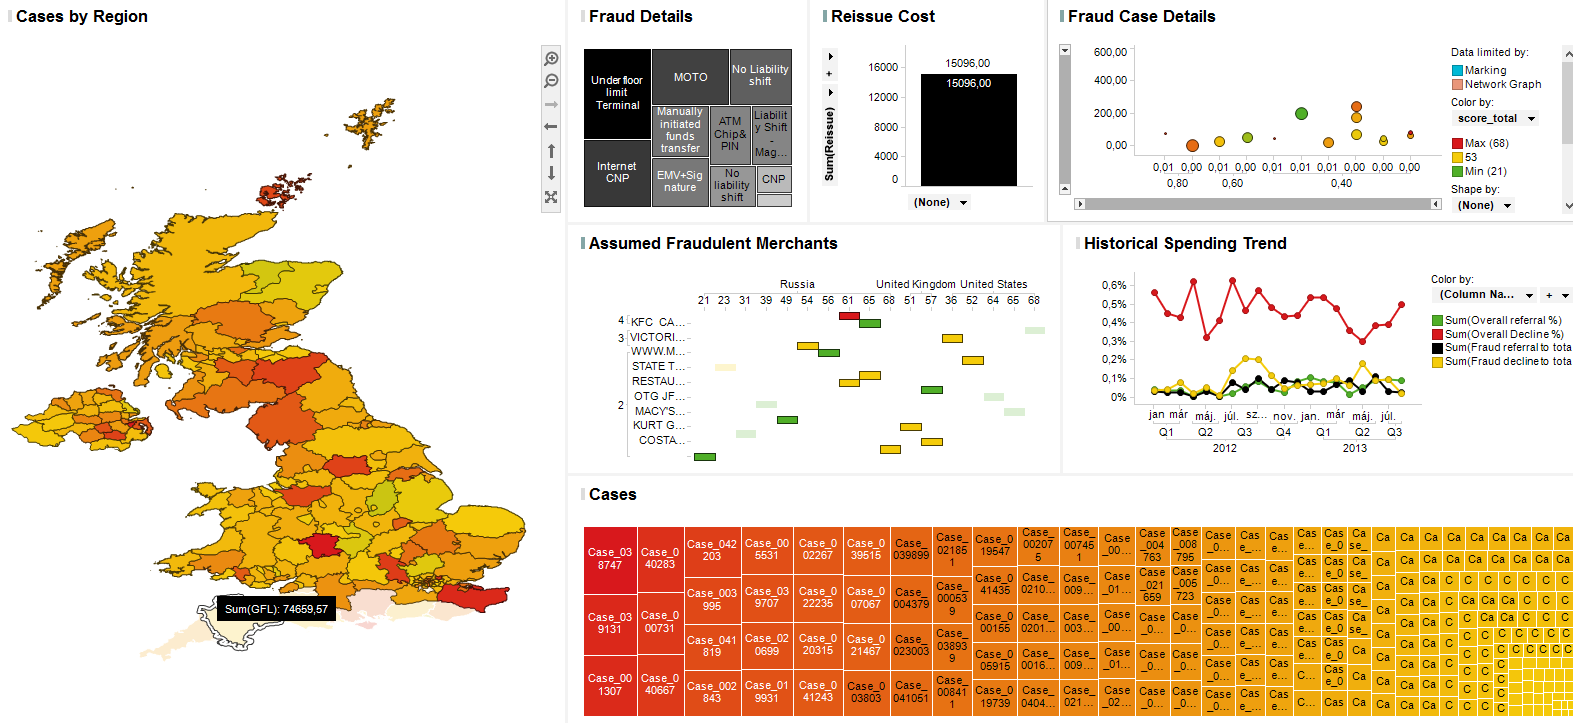
Challenge — One of the key challenges of a Fraud Shop is to identify collusive merchants swiftly to prevent their customers from further losses. How to identify compromised purchase points based on a set of possibly compromised cards?
Key Measures
- Card penetration – Percentage of cards have been used at a certain merchant comparing to all tested cards.
- Fraud score – Measure if risk assigned to a transaction according to the country and merchant category where the card have been used. Scores are calculated based on historical experiences.
- Reissuance cost – Total cost of possibly compromised cards reissuance.
Solution – Compromised Purchase Point report provides You a comprehensive and transparent picture on the transaction history of possibly compromised cards and facilitates identifying the collusive merchants by scoring techniques and statistical measures.
RESULTS
-
Have a prompt and transparent solution that facilitates identifying collusive merchants that results significant loss mitigation.
-
Save FTE by reducing investigation time.
-
Have a detailed and up-to-date picture on Your CPP database to leverage information during the investigation.
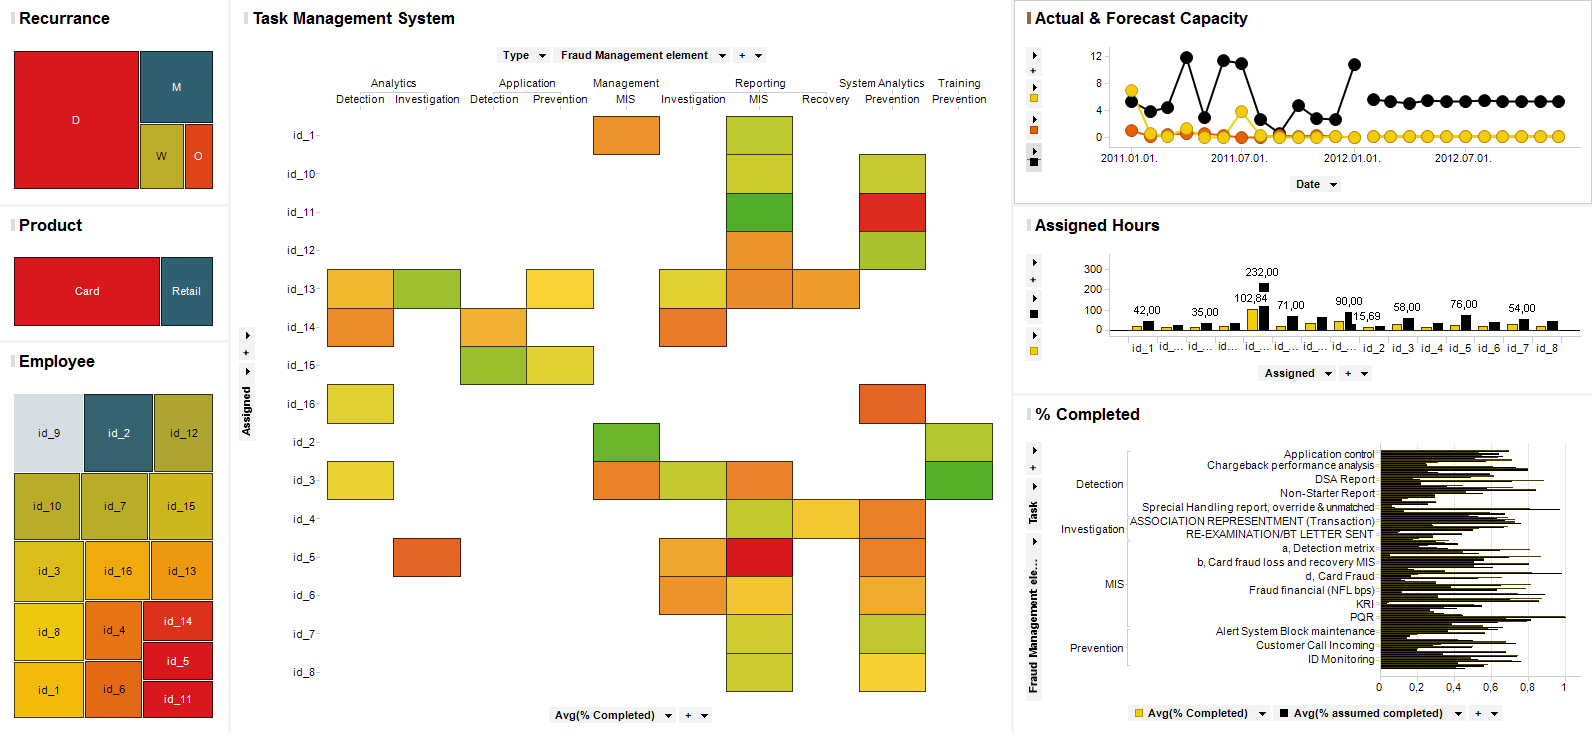
Task Management Report
Challenge – Running a department or a Team requires Managers to have a comprehensive oversight on the tasks assigned to employees, the structure of roles and responsibilities and the effectiveness of execution.
Solution – Our Team developed a report that enables Managers to track all tasks and their readiness in a structured way, adjust roles and responsibilities based on current employee load and set priorities for team members.
Result – Full oversight on employees enables Managers to plan, prioritise and execute tasks effectively and always meet with deadlines when delivering to Senior Management.
Optimal Portfolio Dashboard & Markowitz Model
Challenge:
- Gather portfolio related data automatically and enables analysts as well as managers to see investment opportunities at a glance and visualise current portfolio status.
- What is the most efficient portfolio on the market? How should I allocate my Assets between variety of instruments?
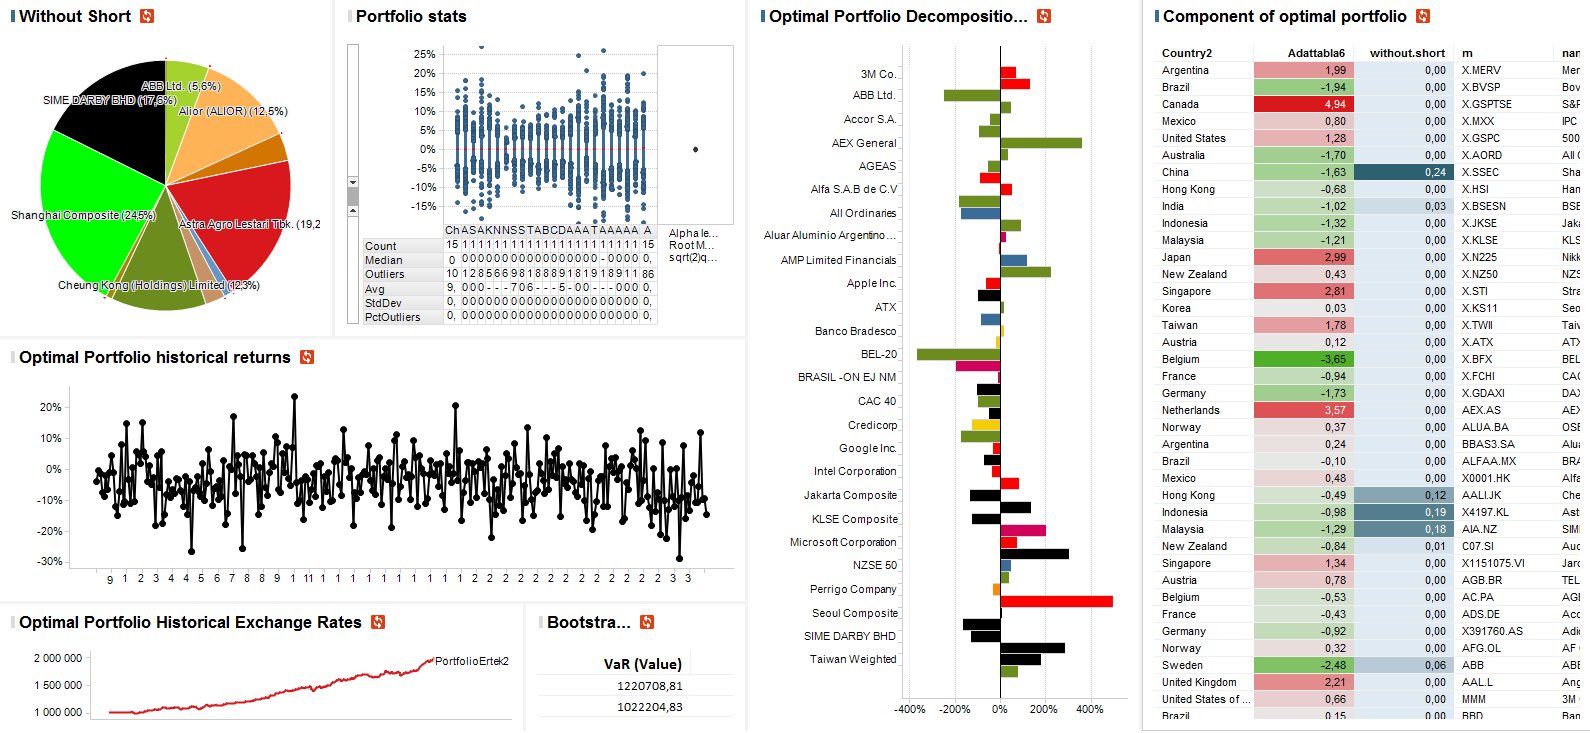
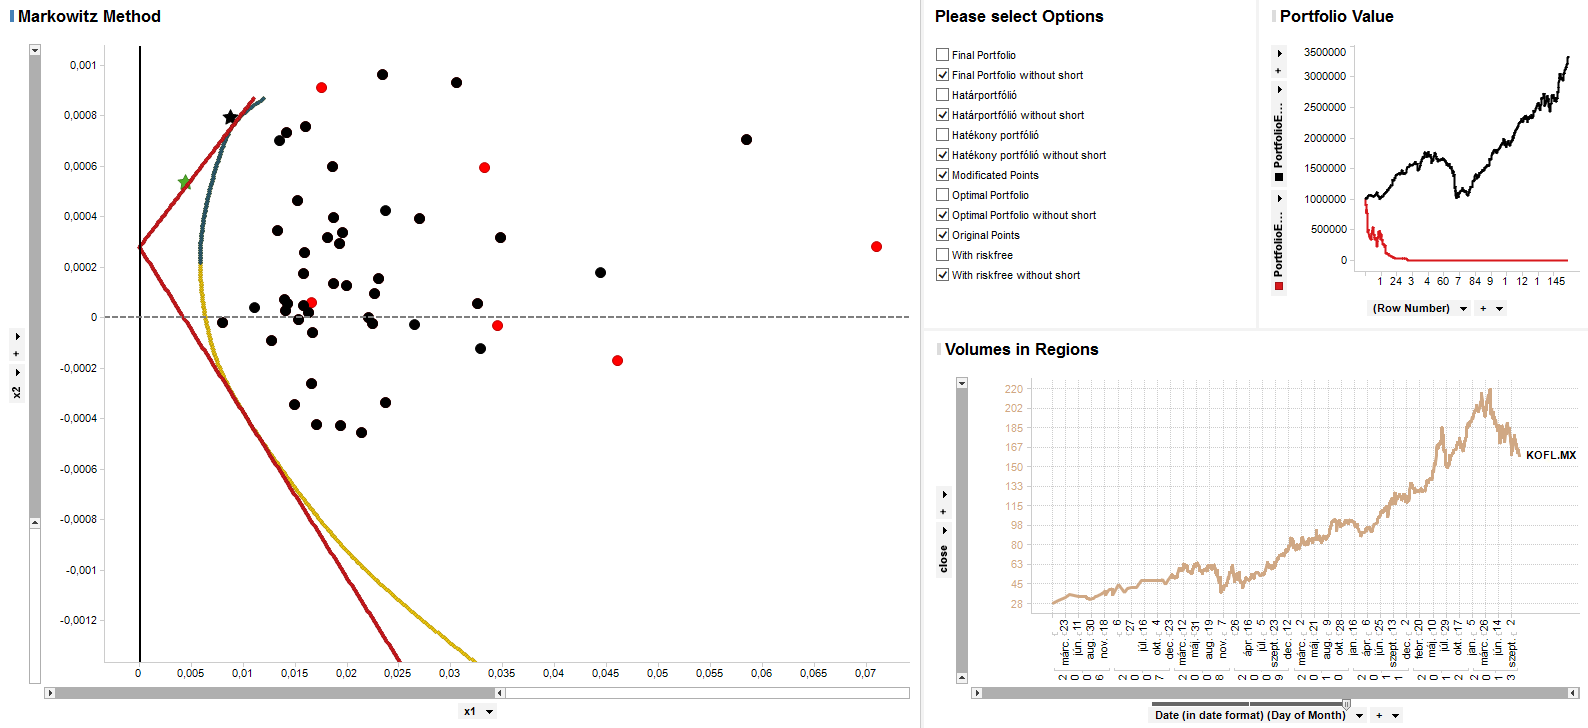
Solution:
- Our team has developed an advanced analytical tool that tests and compares different investment strategies by deploying historical data.
- Our report downloads stock exchange data automatically and calculates optimal portfolio composition by deploying an extended Markowitz-model version while providing large degree of freedom to the user to set parameters and adjust the model with market expectations.
RESULTS
-
Clear and comprehensive view on investment opportunities and reliable analytical stronghold to make investment Decisions.
-
Opportunity to test scenarios on real time stock exchange data, that facilitates better investment decisions.
Financial Planning & Forecasting
Challenge: How should I appropriately forecast my financials to avoid embarrassing moments during the monthly performance quality reports? What factors are need to be considered in the forecasting model? How should I build up a satisfactory business plan?
Solution:
- Planning & Forecast analysis answers above questions by deploying advanced analytical solutions such as what-if scenarios and times series techniques.
- It enables users to coordinate planning activities for multiple stakeholders and purposes.
- Provides comprehensive and transparent oversight on Your cash-flow, revenue & expenditures, sales and inventories forecasts as well as staffing requirements and allocation plan.
- Gives users the opportunity to build their assumptions into the model and report changes dynamically in case of any modification.
- Clears raw data and identify trends and patterns in Your historical numbers that will be considered in the forecast model automatically.
RESULTS
-
Clear and comprehensive oversight on every financial component enables Managers to run a transparent department or company and helps to identify hidden opportunities.
-
Using Automated Advanced Analytical tools are resulting in more accurate planning and FTE/cost save.
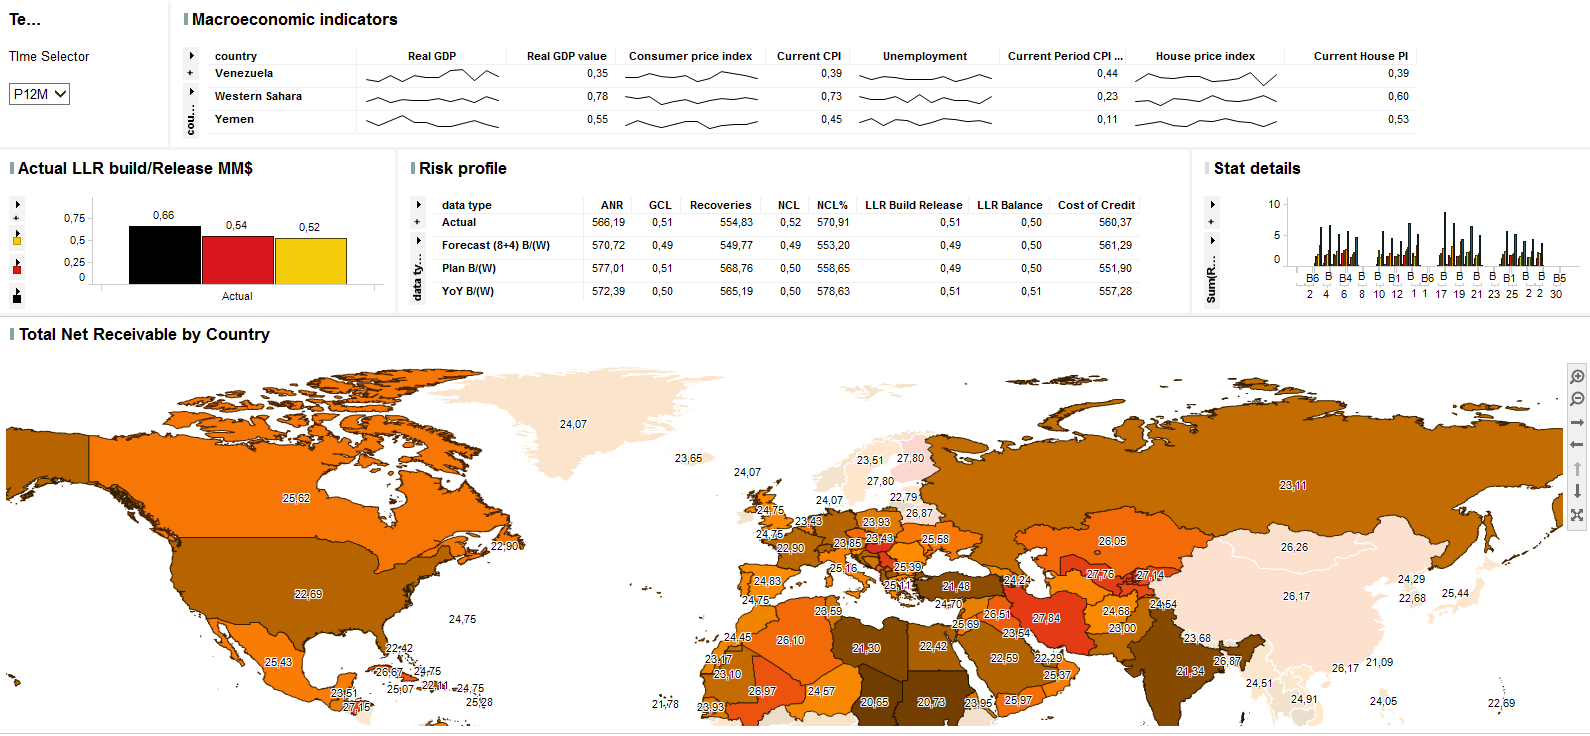
Market Risk
Challenge – How to measure the risk of losses driven by market prices or implied volatility changes?
Solution:
- This report enables Users to have comprehensive view on market risk measures country by country considering currency risk, interest rate risk, equity risk and commodity risk.
- It provides exposure and value analysis (NPV, duration, convexity, sensitivity measures, gap analysis)
- By using simulation techniques users can analyse consequences of decisions in a what-if scenario environment that supports appropriate financial decisions.
RESULTS
-
Better understanding on drivers of market price movements results in more circumspect investment decisions and higher returns.
-
Automated analysis resulting in cost and FTE save.
Operational Risk Analysis
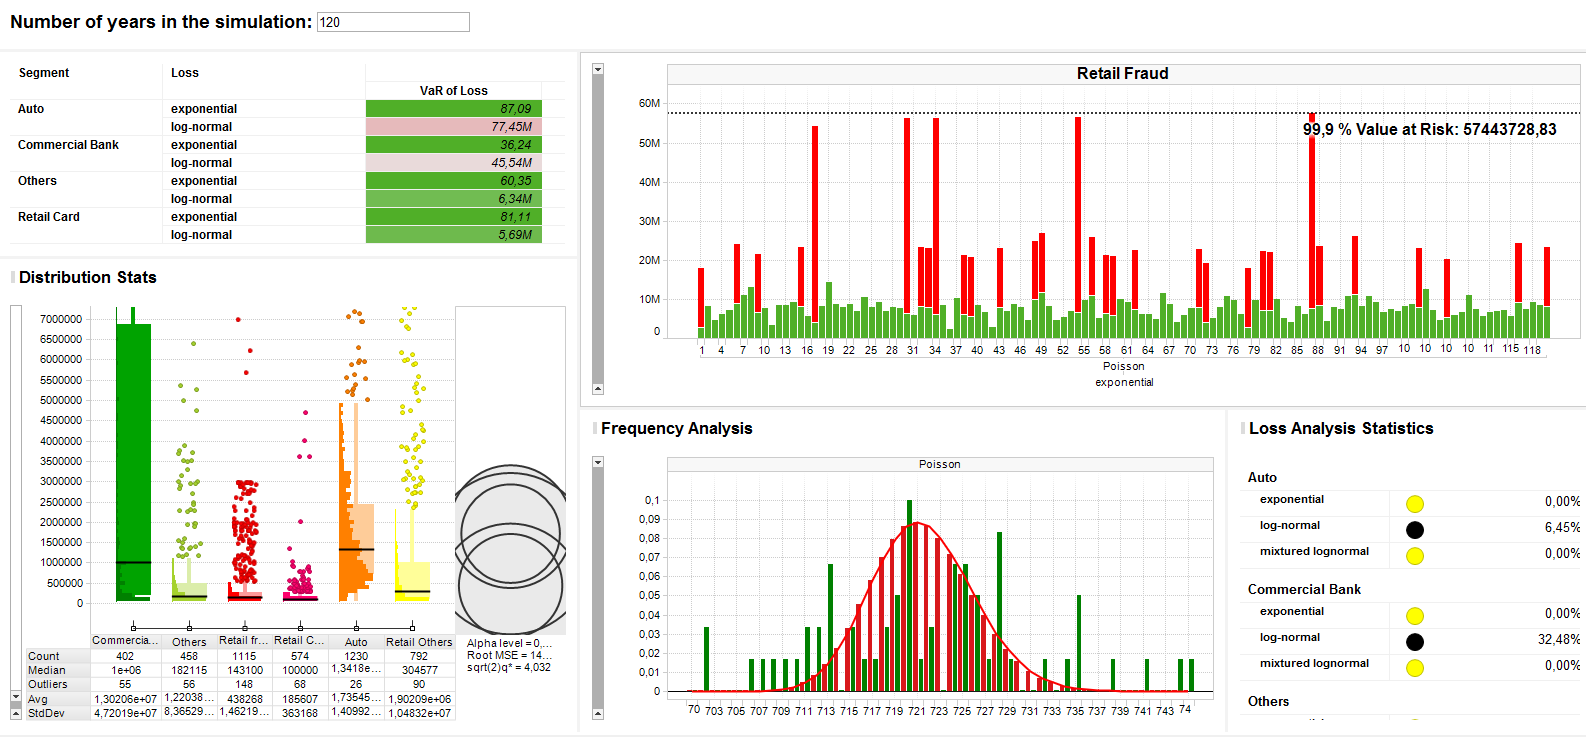
Challenge:
- What distribution best describes the occurrence of loss in different operational risk segments?
- If such a loss occurs what distribution best describes its size?
- What amount of capital is required to cover the total operational risk?
Solution:
This report helps the user calculate operational risk in compliance with Basel II. It offers decision support in determining the loss distribution from historical data. Using the selected loss distribution the report also runs Monte Carlo simulations to determine VaR.
Key Measures:
- Frequency – The number of losses in a given time period
- Size of Loss – The amount lost for each event
- Value at Risk
RESULTS
-
The report allows the user to fit different frequency- and loss distributions to a given database and to see the goodness of the fits. The user can manually choose the most appropriate fit.
-
By choosing the pair of distributions the user obtains the 99.9% Value at Risk, which is the capital requirement specified by Basel II.
-
Using different scenarios this model also takes into account rare loss events which are hard to estimate from historical data.
-
A stress testing function enables the user to determine the stability of the system.
Customer Segmentation - Retention Analysis
Challenge – How can I retain my Clients to close their bank accounts? Which retention tool should I deploy that will most probably work?
Solution – This report provides a customer profiling solution by using segmentation tools based on customer behaviour and financial status. Based on historical data the analysis is able identify the most appropriate and relatively cheap retention tool that has been used successfully in case of similar Customers where we also consider the expected net present value of the profit related to the customer.
RESULTS
-
By using this analytical tool Retention Team is able to swiftly and appropriately identify which retention option should be used to enhance customer satisfaction.
-
Retention of good customers results in portfolio quality and size increase.
-
The automated solution provides the opportunity of saving FTE.
Bankruptcy Model
Challenge – Provides an appropriate segmentation of customers/clients (who will go bankrupt with high probability). To whom I should offer other products?
Solution – By using a mixed Logit model our team developed a solution that identifies good customers with an excellent hit rate.
RESULTS
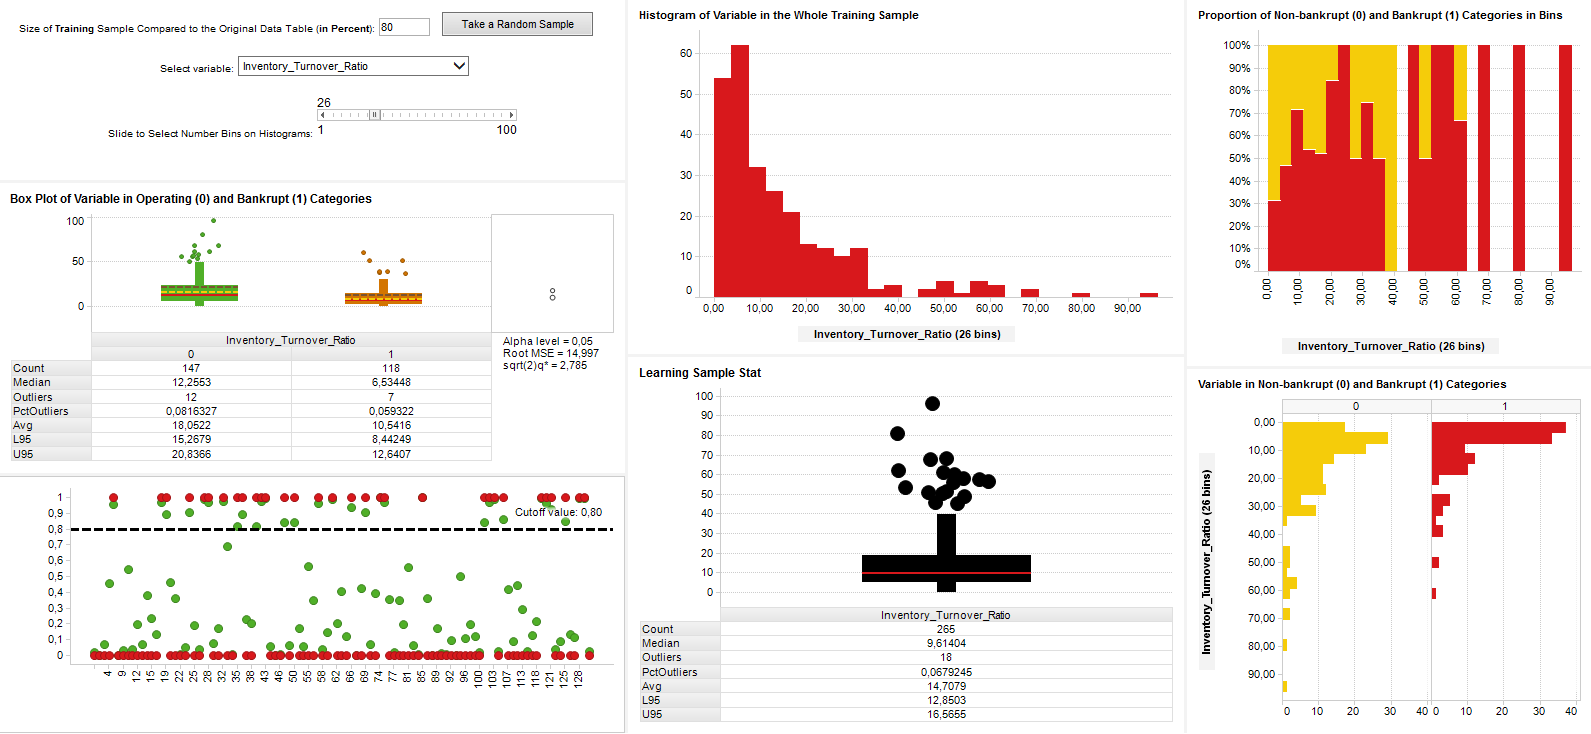
-
Risk mitigation tools can be used proactively that results in a great NCL save.
-
By identifying good customers the analysis facilitates effective cross-selling and up-selling.
Hiking Time Estimation
Challenge — How can we prepare raw GPS track logs that allows us to perform our analysis? Is there a digital elevation model (DEM) that approximates well the actual height values? Is there a function that describes more precisely than the current solutions the relationship between the steepness of the ground and the velocity of the hiker? How can we design a method to estimate the hikers travel time more precisely than the current solutions?
Solution:
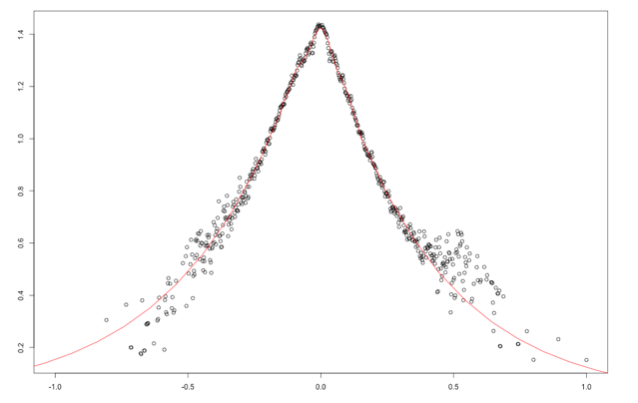
As the elevation data of the GPS track logs are unreliable we created a novel solution to approximate the Earth’s surface. Our Digital Elevation Model is based on NASA Earth’s surface data and uses bilinear interpolation to calculate elevation estimation. Our solution provides very similar results to the values of Google DEM, which is considered to be nowadays the market standard.
The relationship between steepness of the ground and the velocity of the hiker has been determined by Waldo Tobler in 1993, unfortunately it has not been reconsidered or refined until now. Based on 2400 track logs we designed a novel function that enables us to calculate more accurate estimations of hiking time than by using the Tobler-curve.
Figure shows Fitted steepness-velocity function

Naismith’s rule of thumb to estimate the hiking time has been used since 1892. In the era of mobile applications we have the opportunity to refine these approximations. We proposed two estimation methods that collect user information during the trail and adapts the initial estimations dynamically based on the observed circumstances. Our method also accounts for user’s actual physical conditions to personalise estimations.
Figure shows Mean Absolute Relative Error values of the 3 estimation methods
RESULTS
-
DEM enables users to have a far more accurate information on the elevation values of the trail and the distance they walked.
-
The mean velocity based method has resulted in 12.94% mean absolute relative error while the steepness based method reached 11.58%. As per our knowledge, these two methods are the most accurate solutions to estimate hiking time.
-
Our trail time estimation method supports users to plan their tour with high accuracy and predict ETA.
POI Recommender System
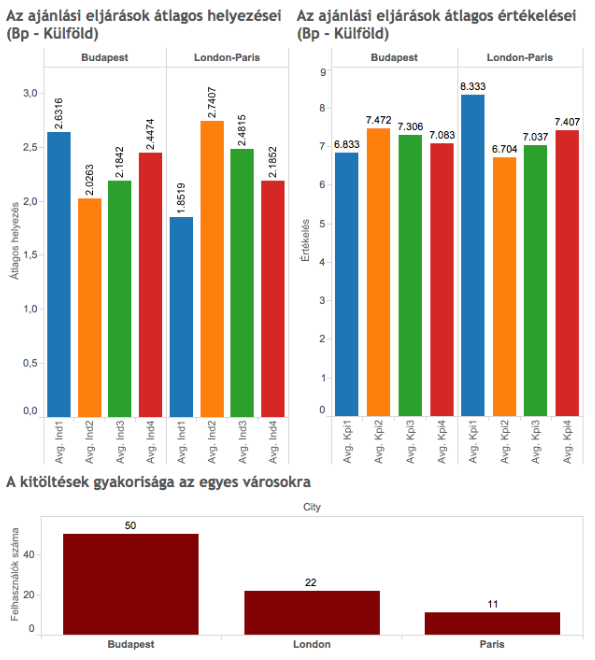
Challenge — Which Touristic Attractions should the User visit in a given city? How can the recommendations be refined by using touristic Factors that best describe the user’s preferences.
Solution:
- Initially we identified 17 individual factors to describe with their linear combinations Point of Interests (POI) related to tourism (eg. museum/art, bath/sport/recreation or history/culture).
- We have created a hybrid (Feature augmenting) recommender system consists of a Knowledge based and a Content based module. Thanks to their characteristics we have overcome the cold start problem and had the ability to recommend users touristic attractions with minimal information shared in the beginning.
- A test instance of 150 POIs consisting of the touristic attractions of Budapest (and 350 further POIs for London and Paris) and asked users to evaluate each item’s attractiveness. As a result, we found that some factors are in close correlations with each other.
- As an interpretation of the grouped factors we have identified 6 different tourist types described by preferring the corresponding factors and used them to refine the accuracy of our initial recommendations.
RESULTS
-
We overcome the challenge of cold start by applying our Feature Augmenting hybrid Recommender System to perform recommendations to users based on very limited initial Information.
-
By introducing Tourist types we provided best possible Recommendations to our users in 86% of cases based on their feedbacks. It was 45pp increase comparing to non-tourist type recommendations.
-
Our recommendations facilitates users to spot travel destinations and plan city tours with ease.
Route Planning Algorithm
Challenge — How can we design an algorithm to solve the Team Orienteering Problem (TOP) that keeps run time low and enables its implementation in a mobile application? How can we accurately describe the user preferences related to tourist attractions by a utility function. What kind of objective function leads our routing algorithm to practically acceptable route plans?
Solution:
- The broadly used objective function has been inherited from the Traveling Salesman Problem (formalised and solved first by Karl Menger in the late 20s), where we can attach particular meaning to collecting profit points by visiting the vertices.
- As per our understanding tourists are not interested in attraction they have evaluated poorly. Hence we designed an objective function as an extension of the broadly applied version, which — instead of the usual, pure profit collection —accounts for travel time (lazy factor) and considers to fully load sightseeing days.
- Our Algorithm provides a fast and personalised solution to obtain city tour plans for multiple days which enables its implementation in a mobile tour planning application.
RESULTS

-
A novel heuristic solution has been introduced to solve the TOP which provides an opportunity implementing in a mobile tour planning application considering its low computation time.
-
Integrated with a POI Recommender Engine Algorithm applies touristic attraction ratings based on user evaluation to obtain tailor made routes.
-
We designed a Utility & Objective Function that considers practical user needs and provides personalised multiple day route planning services.
-
Routes planned by our Algorithm received significantly higher user evaluations than routes based on conventional objective function (8.2 vs 6.4 on a scale 1 to 10).